Data Collection in the Forest
Team members
- Daniel de Angelis Cordeiro
- Fabio de Oliveira Vaz
- Francisco Gatto
- Kelly Rosa Braghetto
- Marcos Eduardo Bolelli Broinizi
- Marcos Tiago Garcia Silva
- Rafael de Holanda Barroso
Preparation
The first thing to do was to read the problem description and to understand it. The team had no previous experience in Design Fest. We've learned everything in classes with professor Fabio Kon from Institute of Mathematics and Statistics at the University of São Paulo.
Assumptions
- Sensors measurement category and unit are immutable.
- Measurements are not directly associated with a configuration. The same sensor can have more than one configuration. Configurations cannot have overlapping time periods.
- Each physical sensor has its own unique ID configurated before deploy and access to a communication device with a specific communication driver.
- The sensor query operation is asynchronous.
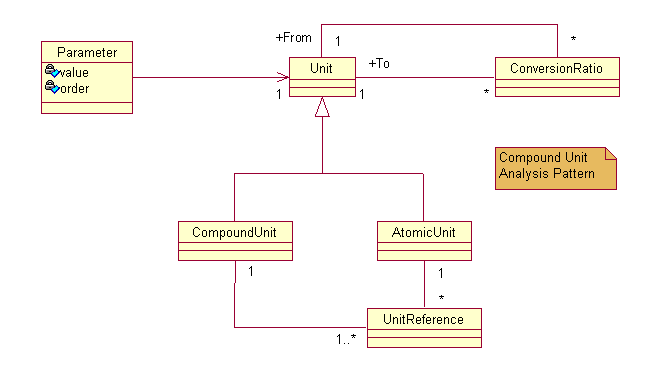
Unit Diagrams
A Unit is used by the Parameter and Sensor. The Compound Unit analysis pattern [2] handles the multiple units requirement.
"The sensors are produced by different manufacturers and return numeric values in a wide variety of units (miles/hour,
km/hour, lumens, watts, calories/day, etc.)... "
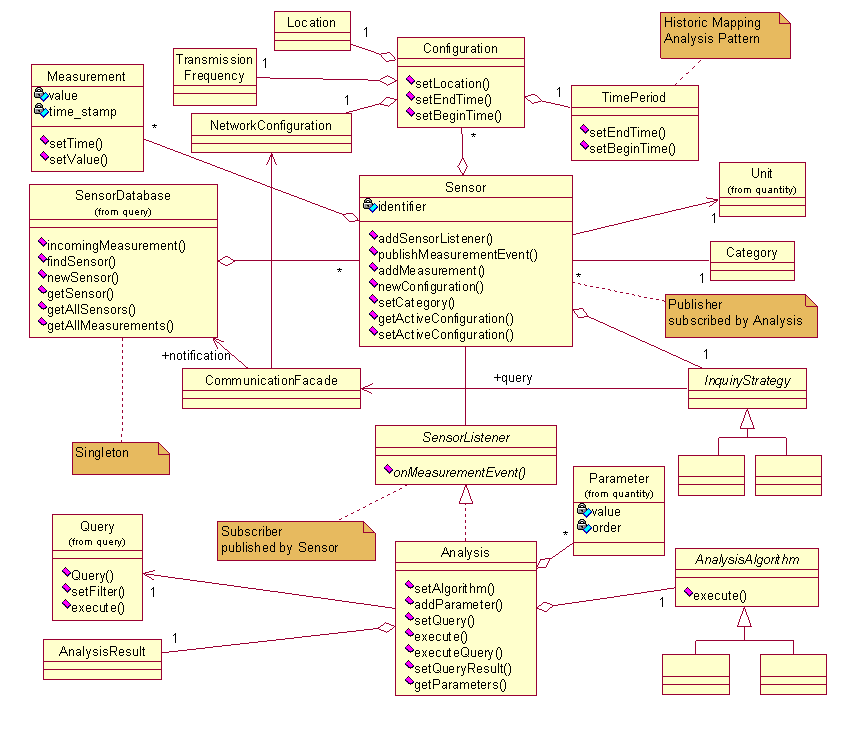
System Architecture
Sensor is the system representation of the physical data sensors in the forest. Its responsabilities includes:
know its category;
know its work unit;
know its configuration historic mapping;
know a way to inquire a physical sensor when requested (Strategy [1]);
know all measurements collected by it, as how to create a new one when required;
know all its subscribers and how to notifiy them when a new measurement is created. (Publisher/Subscriber [3]).
Configuration includes informations as:
physical sensor specification (transmission frequency, manufacturers, tolerances, etc.);
location;
network configuration;
Configurations are modeled as a Historic Mapping analysis pattern [2] in sensors and for this reason includes its active
period.
The CommunicationFacade (Façade [1], Singleton [1]) represents the network layer. A sensor use a InquireStrategy
(Startegy [1]) to create a specific inquire message and send it to a physical sensor through the CommunicationFacade.
All sensor data also arrives through the CommunicationFacade that is able to delegate it to a specific sensor object through
the SensorDatabase.
The SensorDatabase (Singleton [1]) is responsable for findding a specific sensor object using for this a sensor ID, if a
sensor could not be find it creates a new one with this ID.
Analysis is the object that models the capability of gather information and generate reports that are the base of the
system browse and analysis mechanism. Its responsabilities includes:
knows a query;
knows its AnalysisAlgorithm (Strategy [1]) that knows how to process the raw data in query, as to determine if it's
necessary to update the AnalysisResult due to an new notification received;
knows a parameter that can be accessed by the analysis algorithm to fulfill its behavior;
acts as a subscriber of a Sensor. (Publisher/Subscriber).
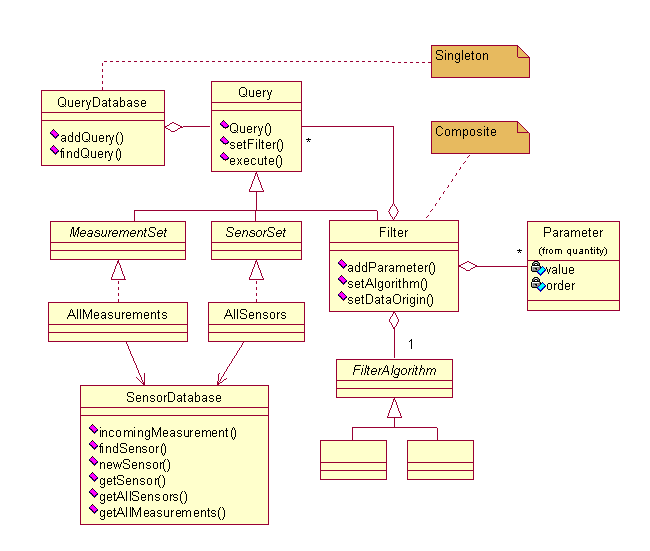
Query Diagrams
Query object represents a data selection tree. To model this, was used the Composite pattern [1]. Each node defines a
filter compound of a filter algorithm and a collection of parameters . The algorithm gathers the data filtered by its
sub-trees and then aply its own parametric filter strategy, resulting in a new filtered set of data. A filter can be
something as simple as a "less than (<=)" filter algorithm with a numeric parameter "17" or even a more sofisticated
operation that retrieve all measurements from a set of sensors, the last modeled as a filter that has no parameters and
gathers sensor data from its sub-trees, retrieving measurement data as result. The leafs of a tree are measurements or
sensors sets. This model has a concrete realization of each set, the AllMeasurements and AllSensors that uses the
SensorDatabase to retrieve all measurements or all sensors in the system, respectively. Users can create new concrete
realizations of these abstract classes. Queries are stored in the QueryDatabase (Singleton [1]), so it can be reused in more
than one analysis, as sub-trees of others queries and even accessed by the users directly.
Sequence Diagrams
The Data Collection sequence diagrams were designed based on scenarios described in project specification.
Scenario 1 - Data Analysis
Talks about data analysis on a group of sensors. Two diagrams were created; the first one deals with the creation of a
sensors group, and the other shows how to make a analysis on pre-selected data.
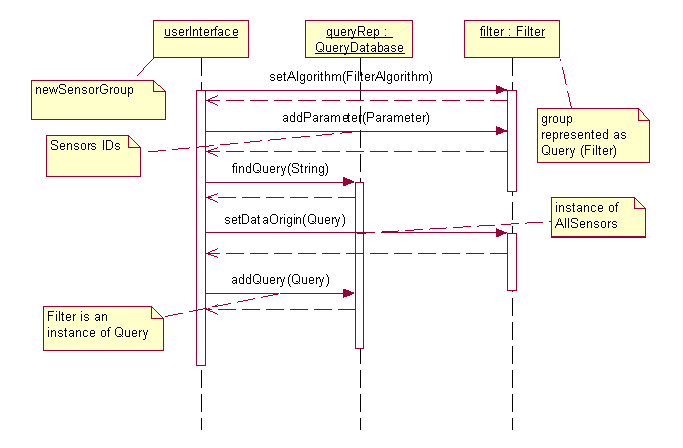
Figure 1 - A group creation
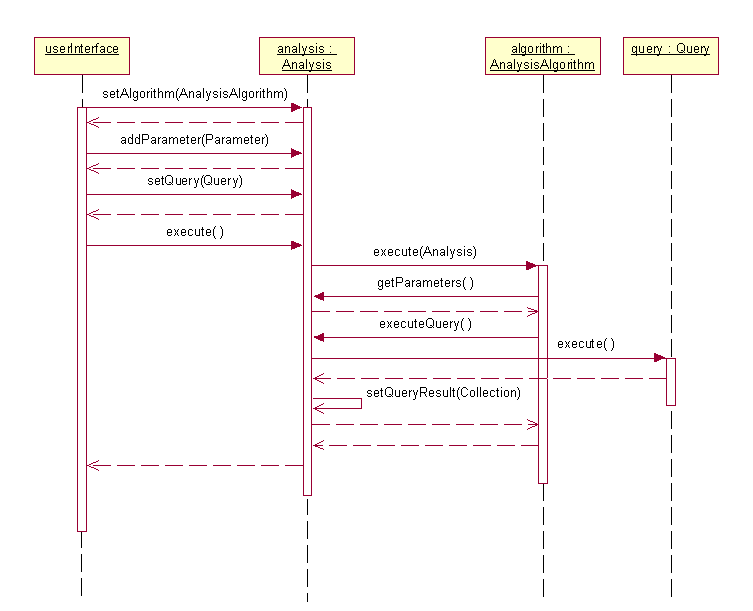
Figure 2 - Data Analysis
Scenario 2 - Installation of New Sensors
New sensors can generate measurements before their installation is finished (i.e., the sensor's configuration will not be in
the server when the first measurements arrives). The system stores this measurements associating them with a new sensor
without configuration data. After that, a configuration can be created for the sensor.
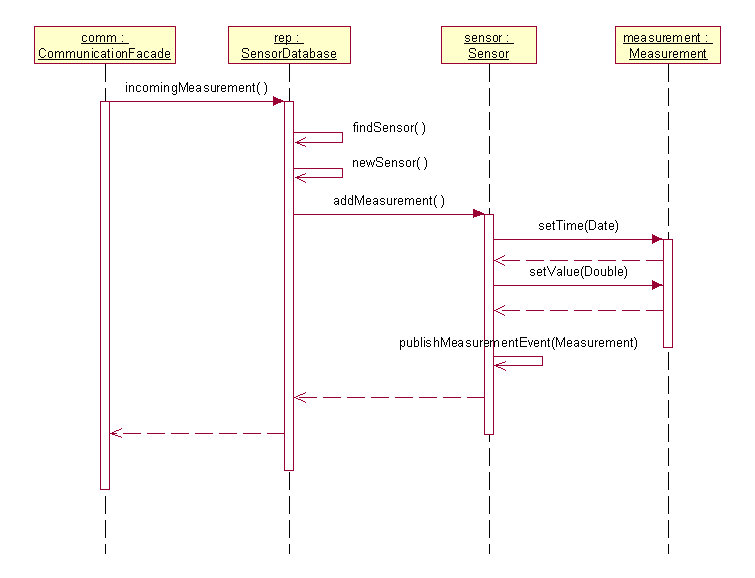
Figure 3 - Measurements from a new sensor
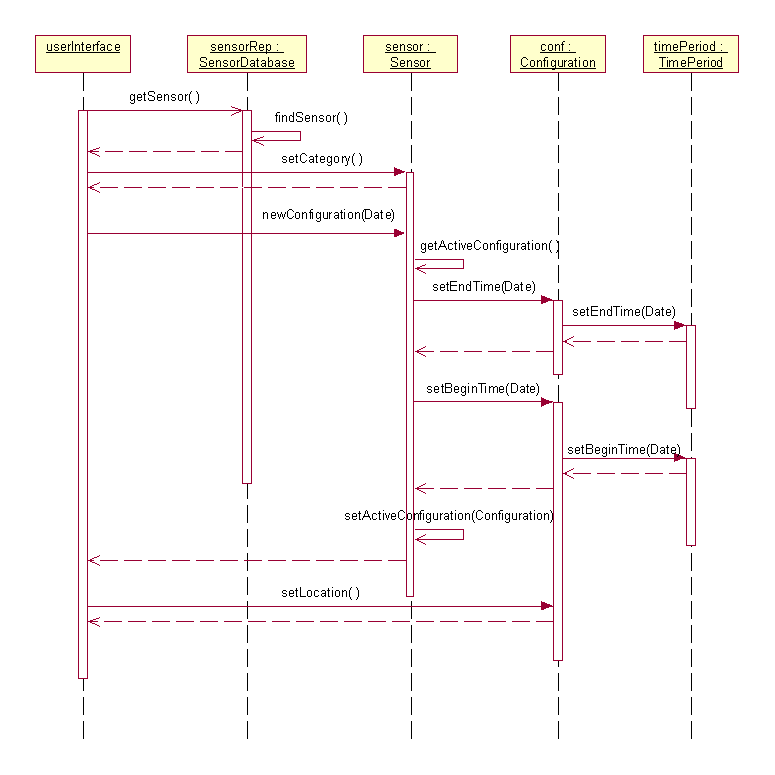
Figure 4 - Creating a new configuration for a sensor
Scenario 3 - Sensor Reliability Example
Describes a sensor information update. This process is made by creating a new configuration for a sensor.
This scenario is also accomplished in figure 4.
Documents
References
- [1] E. Gamma, et. al.; Design Patterns: Elements of Reusable Object-Oriented Software, Addison-Wesley, 1994.
- [2] M. Fowler; Analysis Patterns: Reusable Object Models, Addison-Wesley, 1997.
- [3] F. Buschmann, R. Meunier, H. Rohnert, P.Sommerlad, M. Stal Pattern-Oriented Software Architecture - A System of
Patterns. John Wiley and Sons Ltd, 1996.